Contour plots of omitted variable bias for sensitivity analysis of instrumental variable estimates.
The main inputs are an iv_fit model, and the covariates used for benchmarking the strength of omitted variables.
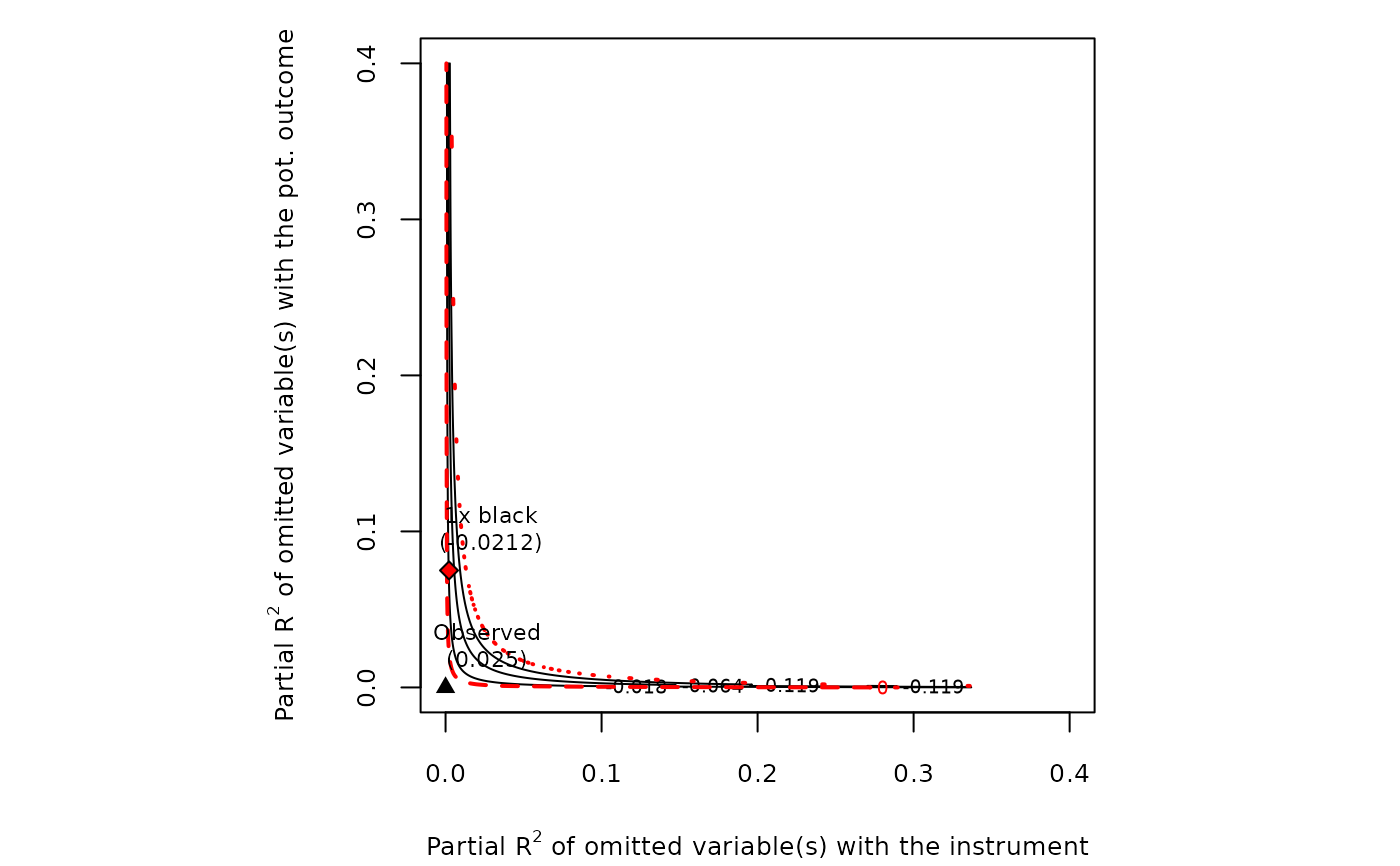
If parm = "iv" (default) contour plots of the IV estimate are shown. The horizontal axis of the plot shows hypothetical values of the partial R2 of latent variables with the instrument. The vertical axis shows hypothetical values of the partial R2 of latent variables with the (pot.) outcome. The contour levels represent the adjusted lower limit (or upper limit) of the Anderson-Rubin confidence interval of the IV estimate, or the t-value for testing a specific null hypothesis. The reference points are the bounds on the partial R2 of latent variables if they were k times "as strong" as the observed covariate used for benchmarking (see arguments kz and ky). The dotted red line show the chosen critical threshold (for instance, zero): latent variables with such strength (or stronger) are sufficient to invalidate the research conclusions.
if parm = "fs" or parm = "rf", then contour plots of the first-stage and reduced-form regression are shown. See, e.g, ovb_contour_plot.lm.
See Cinelli and Hazlett (2020, 2025) for details.
Usage
ovb_contour_plot(...)

# S3 method for class 'iv_fit'
ovb_contour_plot(
  model,
  benchmark_covariates = NULL,
  kz = 1,
  ky = kz,
  kd = kz,
  sensitivity.of = c("lwr", "upr", "t-value"),
  parm = "iv",
  r2zw.x = NULL,
  r2y0w.zx = r2zw.x,
  bound_label = "manual bound",
  xlab = NULL,
  ylab = NULL,
  ...
)
Arguments
- ...
further arguments and graphical parameters.
- model
a model created with the function
iv_fit.- benchmark_covariates
character vector of the names of covariates that will be used to bound the plausible strength of the latent variables.
- kz
numeric vector. Parameterizes how many times stronger the latent variables are related to the instrument in comparison to the observed benchmark covariates. Default value is
1(latent variable is as strong as benchmark covariate).- ky
numeric vector. Parameterizes how many times stronger the latent variables are related to the (pot.) outcome in comparison to the observed benchmark covariates.
- kd
numeric vector. Parameterizes how many times stronger the latent variables are related to the treatment in comparison to the observed benchmark covariates. Default value is the same as
kz.- sensitivity.of
should the contour plot show adjusted lower limits of confidence intervals (
"lwr"), upper limit of confidence intervals ("upr") or t-values ("t-value")?- parm
contour plots of which estimate? Options are
ivfor instrumental variable estimates,fsfor first-stage estimates, andrffor reduced-form estimates.- r2zw.x
(optional) hypothetical partial R2 of latent variables W with the instrument Z, given observed covariates X.
- r2y0w.zx
(optional) hypothetical partial R2 of latent variables W with the (pot.) outcome Y(0) given Z and X. Default is the same as
r2zw.x.- bound_label
label to bounds provided manually in
r2zw.xandr2y0w.zx.- xlab
label of x axis. If `NULL`, default label is used.
- ylab
label of y axis. If `NULL`, default label is used.
Value
The function is called for its side effect of producing a contour plot.
It invisibly returns a list with the grid values used for the contour plot.
Details
Other parameters include:
alphasignificance level.
thresholdcritical threshold, default is
0.limlimits for the axes.
lim.xlimits for the x axis. Default is
lim.lim.ylimits for the y axis. Default is
lim.nlevelsnumber of levels in the contour plot.
col.contourcolor of the contour lines.
col.thr.linecolor of the threshold line.
label.textshould benchmark label texts be shown? Default is
TRUE.cex.label.textcharacter size of label text. Default is
.7.label.bump.xbump on the x coordinate of label text.
label.bump.ybump on the y coordinate of label text.
cex.labThe magnification to be used for x and y labels relative to the current setting of cex.
cex.mainThe magnification to be used for main titles relative to the current setting of cex.
cex.axisThe magnification to be used for axis annotation relative to the current setting of cex.
aspthe y/x aspect ratio. Default is 1.
If parm = "fs" or parm = "rf" the function is simply a wrapper to the sensemakr function ovb_contour_plot.lm on the first-stage or reduced-form lm models.
References
Cinelli, C. and Hazlett, C. (2020), "Making Sense of Sensitivity: Extending Omitted Variable Bias." Journal of the Royal Statistical Society, Series B (Statistical Methodology).
Cinelli, C. and Hazlett, C. (2025), "An Omitted Variable Bias Framework for Sensitivity Analysis of Instrumental Variables." Biometrika. doi:10.1093/biomet/asaf004
Examples
data("card")
y <- card$lwage
d <- card$educ
z <- card$nearc4
x <- model.matrix( ~ exper + expersq + black + south + smsa + reg661 + reg662 +
                     reg663 + reg664 + reg665+ reg666 + reg667 + reg668 + smsa66,
                   data = card)
card.fit <- iv_fit(y, d, z, x)

# contour plot of the lower CI limit
ovb_contour_plot(card.fit, sensitivity.of = "lwr",
                 benchmark_covariates = "black")